Image Quality Assessment
Introduction
Being able to measure the quality of the image displayed by our device is of crucial importance. It would allow the community to quantify the progress between two versions of the device, but it may also be useful to prove that the echOpen device is reliable. Even if some parameters such as the framerate or the transducer’s bandwidth can be measured and are known for having an impact on the image quality, a global approach taking the whole system into account is necessary.
However, quantifying the quality of an ultrasound imaging system is difficult as no objective criteria has yet been fully developed and accepted for the evaluation of the quality of a clinical image. For the moment, it is generally performed subjectively by a specialist, even if a few techniques providing relevant measures have been developed in the past years [7] .
The first point of this document is a presentation of the criteria that may be used to characterize the image quality and the corresponding parameters, the second one is about existing methods that are used for image quality assessment, and the last one is about the relevance of those different techniques in the echOpen project. It must be pointed out that clinical trials are expensive and time consuming. They should be used for the final device only, in order to get medical certifications.
Criteria to characterize the quality of an ultrasound image [2]
Some of the relevant parameters for quality assesment are described in the following list. Their values are primarily affected by the properties of the transducer and the ADC(analog to digital device), by the pulser and the amplifier and by signal processing.
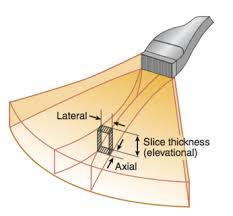
Spatial resolution
In ultrasound imaging the spatial resolution is usually divided into two concepts. Lateral resolution is the ability to resolve details from each other when they are near each other on lines perpendicular to the ultrasound beam. Accordingly, axial resolution is the pability to resolve details that are near each other on lines parallel to the ultrasound beam. A third resolution called elevation resolution defines how thin a layer the transducer is capable of separating from adjacent layers in the object. The spatial resolution may be affected by some of the transducer’s properties such as its geometry, as it affects the beam width (for the lateral resolution) or its bandwidth that may change the pulse’s length (for the axial resolution). The frequency of the transducers also changes the depth at which the better resolution is observed. [1]
Contrast resolution
The contrast resolution is a measure of the ability to distinguish objects that have close acoustic properties. It can correspond to the detection of different tissues, of anechoic objects (objects that are free from echoes and reverberation such as cysts) or scattering objects such as tumours.
Time resolution
The temporal resolution is a measure of the fastest object motion that can be detected by the device. It is relative to the transducer and the framerate.
Sensitivity
Sensitivity is a measure of the minimum detectable inhomogeneity. It is affeceted by the Signal to Noise Ratio (SNR) or by the penetration (the depth at which the SNR falls below 6dB), but it may also be affected by spatial and contrast resolution.

The Resolution Integral
The Resolution Integral is a mathematical transformation that produces a single figure of merit for image quality from individual measurements of resolution over a range of depths. The idea is that a good image is correlated with a narrow beam width and a good penetration into soft tissues, so a notional metric of performance could be calculated as the ratio R = Penetration / Beam Width. For weakly focused imaging beams, the variation of ultrasound beam characteristics with depth can be accounted for using an integral approach. The metric can then be written as: where is the effective beam width and is the axial distance over which the effective beam width is less than .
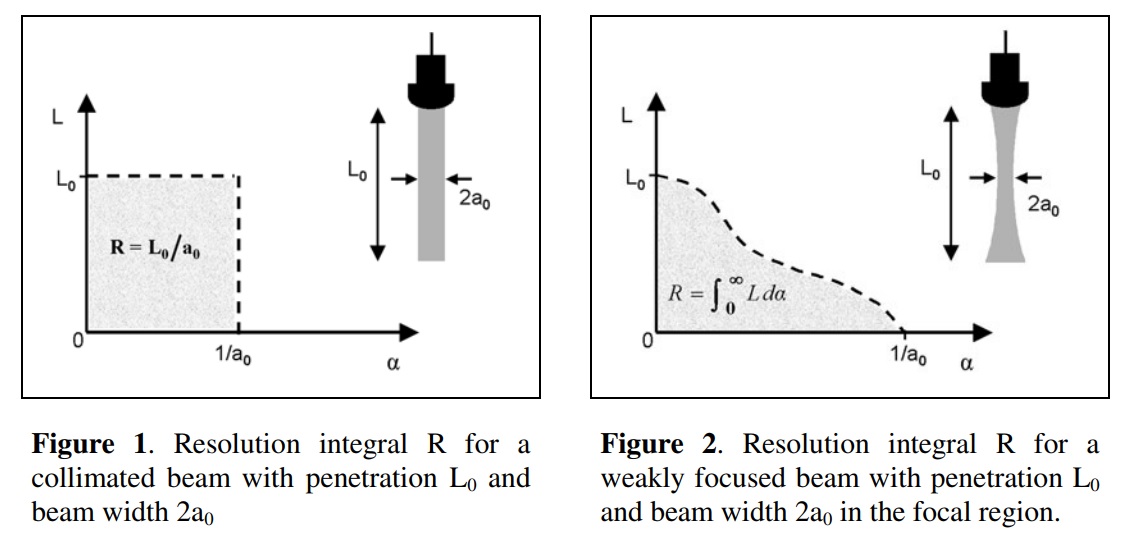
The L-α curve is bounded on the y-axis by L0, the ‘length of the beam’. Beyond that point, the beam still exists but cannot be distinguished from the noise because its intensity is too low. This is also called the noise limit. On the x-axis, the curve is limited by 1/a0, where a0 represents the best spatial resolution. A transducer with a good penetration and a good spatial resolution tends to have a large value for the Integral Resolution.
Here is a link towards the article: https://pdfs.semanticscholar.org/1eae/a3fcfd9eca87ebaccb5d6b605655f1f003b3.pdf .
Image quality measure based on error sensitivity
Mean Square Error (MSE) is the most commonly used image quality measure. The goal of this measure is to compare two images by providing the quantitative score that describes the degree of similarity or the level of distortion/error between the two images. MSE is easy to calculate, memory less and it has a clear physical meaning as it defines the energy of the noise image. The MSE can be converted into Peak Signal to Noise Ratio (PSNR). MSE and PSNR are easy to calculate, memory less and have a clear physical meaning (MSE is a measure of the energy of the image and PSNR defines the energy of the noise image. However, those measures may not correspond to human perception because digital pixel values may not exactly represent the light stimulus entering the eye, because the summation process implemented in those techniques has little to do with the way our brain perceives a distortion between two images and because two distorted image signals with the same amount of error energy may have very different structure of errors.
Mean Square Error between two images A and B (same dimensions): N is the number of pixels in each image. (resp. )is the value of the pixel located in position (i,j) in image A (resp. B).
Existing methods for image quality assesment
Some of the previous parameters can be determined almost directly thanks to data image processing. But for most of them, the use of objects called tissue mimicking phantoms is necessary.
Data image processing
Data image processing consists in using the values of the pixels from one or different images to calculate the value of certain parameters. It can be used to calculate the Mean Square Error between two images or the BNR for axample. It can also be used to analyse the images obtained from the scanning of different phantoms.
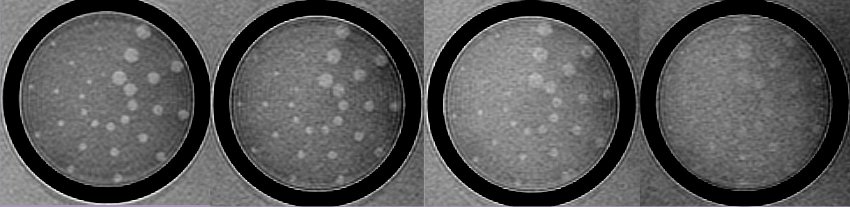
Tissue mimicking phantoms [3]
A tissue mimicking phantom is an object designed to test the ability of ultrasound scanners to detect particular objects. It is composed of materials that can reproduce the acoustic properties of human tissues. Tissue mimicking phantoms are interesting as we know their geometry. There is a page dedicated to tissue mimicking phantoms in the Gitbook , just click here to jump to it.
What we could do at echOpen
In this section, I write some of the ideas that came to my mind when I read articles about Image Quality Assessment. I am not an expert, these are only suggestions that could be used to start further reflections on that topic.
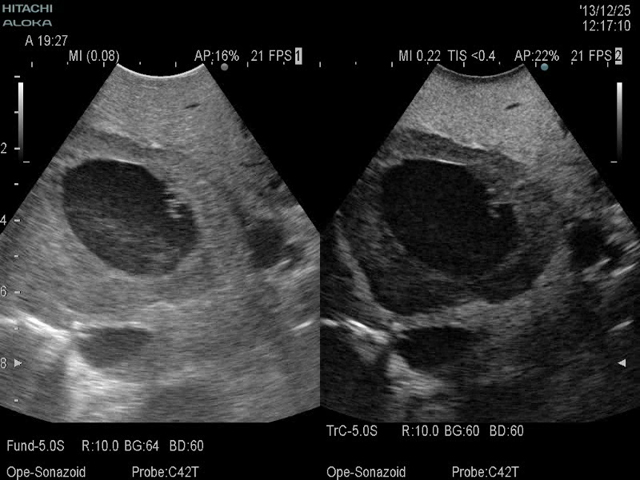
At echOpen we try to design a low-cost ultrasound scanner. In order to measure the quality of the image displayed by our system, we could use a scanner that is considered as a good one and compare the images with the Mean Square Error method. As we work in a hospital, it shouldn’t be so difficult to access such a scanner, the main practical problem is that it must be difficult to take the exact same picture twice with different probes.
It would also be interesting to use a tissue mimicking phantom to measure some of the parameters above including the Resolution Integral. The problem is that tissue mimicking phantoms for quality assessment cost about $2,000. Some recipes to make home-made and cheap tissue mimicking phantoms exist, but those phantoms are mostly used for the training of students in medicine, not for scanners quality assesment. A 2-axis table that could be put in an aquarium is currently being developed by the community, to test the basic resolution properties of the scanner.
2-axis table
The following 2-axis table is being constructed by a few echtopians and students from the CRI Labs Summer School.
The pen will be replaced by a thin object,a tungstene wire for example. The purpose is to measure the beam width at different depths. To measure the beam width at a certain depth, the tungstene wire is moved in a plan perpendicular to the propagation axis. When the wire is on that axis, the maximum amplitude is measured. Then the received amplitude is measured for different distances betweeen the axis and the wire. A graph similar to the following one is supposed to be obtained.
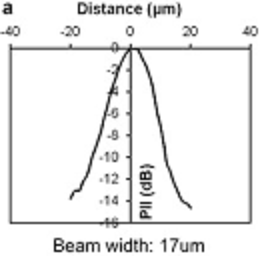
Then the beamwidth can be estimated according to different conventions on the limit in dB.
The beamwidth is related to lateral resolution as two details located at a distance d from each other won't be distinguishible if d is smaller than the beamwidth.
Direct measure of resolution
Here is an idea to measure the spatial resolution. We could put a wooden plaque on the aquarium and hang thin wires to that plaque. By changing the distance between the wires we could determine axial and lateral resolution experimentally. The verticality of the wires could be ensured by small weigths at the end of each wire. This measure would probably take a lot more time than the measure of the beamwidth with the 2-axis table. The ideal tool would be a 2-axis table for 2 separate wires, but there would obviously be room problems at the top of the aquarium. A system similar to the one presented in that article [3] would be more relevant. There, the two wires are fixed at the same motors and a third one can be used to change the distance between the two wires.
Home-made tissue mimicking phantoms
The previous methods could allow us to determine spatial resolution but contrast resolution, sensitivity and uniformity measures are not relevant if the acoustic properties (attenuation in particular) are not close to the human body's. As said before, tissue mimicking phantoms are really expansive and we should , in a first approach, try to make our owns even if they are less relevant. Here is a page of the Gitbook dedicated to tissue mimicking phantoms.