Protocol for image quality assessment
To get basic explanations about image quality assessment, jump here.
Measurement of spatial (detail) resolution
A few remarks about spatial resolution
We want to measure both lateral and axial resolutions:
The resolution is the smallest distance x between two wires that allows to separate them on the final image.
lateral resolution : perpendicular to the propagation axis of the acoustic pulse, in the plane of the image
depends mainly on the transducer's focalization, but may also by affected by the number of lines, post-processing such as envelope extraction, signal-to-noise ratio, etc...axial resolution : parallel to the propagation axis of the acoustic pulse
depends mainly the transducer's frequency, but may also be affected by ADC sampling rates, post-processing such as envelope extraction, possible defaults in the TGC, signal-to-noise ratio, etc...
The lateral resolution varies as a function of depth (relatively to the transducer's position)
This is directly linked to the focalization of the transducer. For this reason, we have to monitor the lateral resolution as a function of depth.
To do so, we need to perform measurements while being able to fix precisely the distance to the transducer.
The lateral resolution has to be measured in the range of depths that have been previously determined depending on the transducer's frequencies (see table below). For each range, we need to perform several measurements (let's say about 10, which would roughly correspond to measuring the resolutions with a step of 1cm in depth)
The distance interval in which a transducer will be used depends on its frequency (and this latter directly determines the axial resolution). So we need to compare the resolutions only for transducers that have comparable frequencies.
| Frequency (MHz) | Usage zone (mm) |
|---|---|
| 3.5 | 50 - 200 |
| 5 | 30 - 150 |
| 7.5 | 10 - 100 |
Phantom for spatial resolution
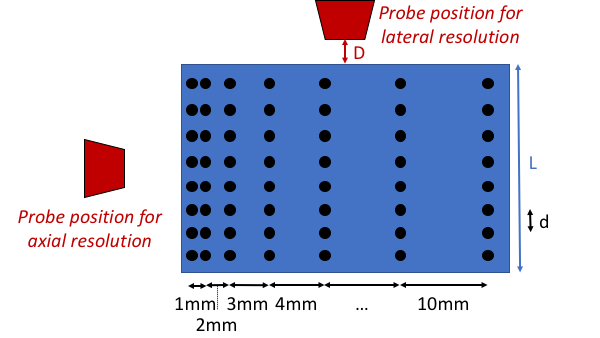
The phantom that could be used for spatial resolution is represented in the figure below (the position of the probe is represented by a trapezium). The resolution corresponds to the minimum value of x that allows to distinguish two neighboring wires (black dots).
- D must be carefully fixed to be able to monitor the lateral resolution as a function of depth.
- d is the (constant) step in depth for resolution measurements. Typically, d=1cm. Knowing D, we can assess the distance for each point of measurement
- From the table above describing the ranges of interest, L=15cm typically.
- The resolution corresponds to the minimal distance that allows to separate two consecutive vertical lines.
Protocol for spatial resolution
For a given combination of transducer + acquisition/processing chain:
Save a few images and the corresponding raw signals (this is for the specific task of envelope extraction, jump here for more details)
The lateral/axial resolution corresponds to the minimal value of x allowing to distinguish two neighboring wires.
As the axial resolution is not expected to vary with depth, only one figure will characterize the quality.
The lateral resolution varies as a function of depth, then a curve of lateral resolution vs. depth has to be drawn. To do so, the distance D between the phantom and the probe has to be fixed carefully. For 3.5MHz transducers, D=5cm (this is to perform the measurements in the range of usage 5-20cm).
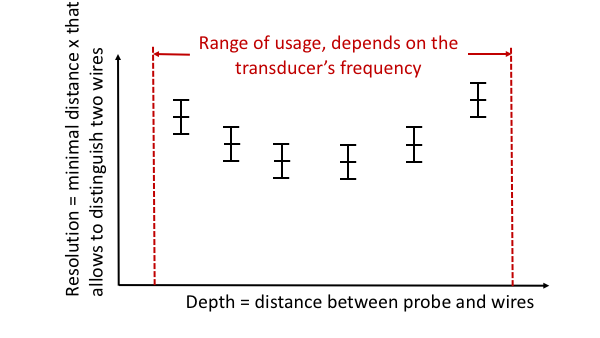
The figure below shows the curve that is expected for lateral resolution:
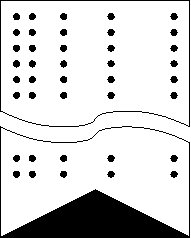
This phantom will be put in the bottom of a water tank. The problem is that the acoustic wave will be reflected by the bottom of the tank an some artefact will appear on the image like ghost images supperposed on the original image. To avoid this we can put a absorbing plate under the phantom but we have to find the right platic that will have an acoustic impedance close to the one of the water and with high absorbtion or large width. The other solution is to put a triangulare shape in random platic on the back of the phantom, so the acoustic will be reflected part reflected not on the direction of the probe and part absorbed by this plastic. The simplier way to do this is to 3D print this an include it in the phantom like on the figure below.

Measurements of sensitivity
coming soon...
Measurement of contrast resolution
coming soon...