Signal processing function

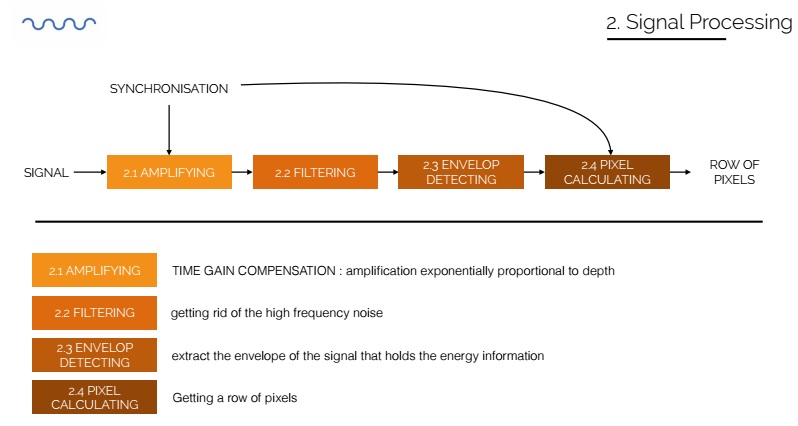
Figure 19: Functional analysis
The approach presented here maximises the use of analog signal processing in order to reduce the required sampling rate for the digital part. It allows lower costs and less energy consumption. The circuit is sensitive to noise.
TGC amplification
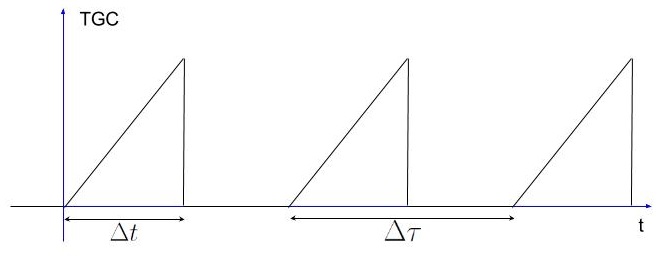
When the wave propagates through soft tissues it is attenuated. The attenuation increases with frequency, so the higher the frequency, the shorter the penetration depth. In ultrasound scanner, this attenuation is counterbalanced with a Time Gain Compensation (TGC). The acoustic wave decrease exponentially with distance, therefore the TGC is a function increasing exponentially with distance so that the result of the product is a constant, and the signal loss due to distance is offset. For the echo-sthetoscope, penetrated tissues have different impedances and the attenuation law is not a simple exponential. However a linear approximation of the TGC is appropriate.

Figure 20: TGC amplification command
Second filtering
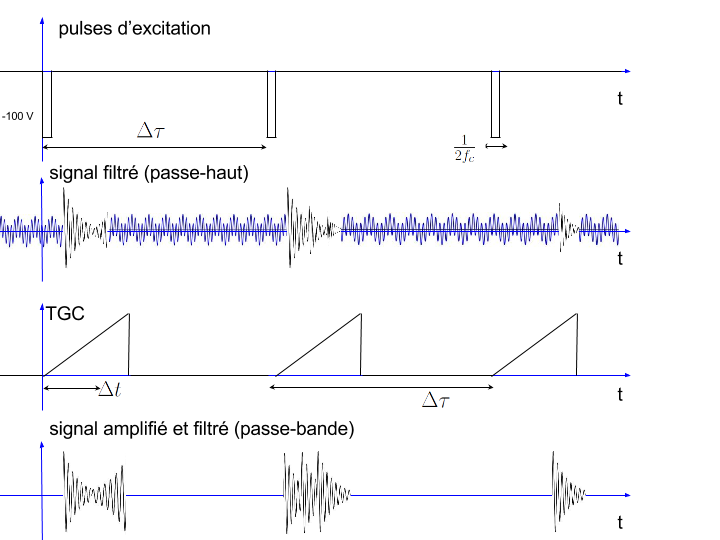
The starting signal is noisy and the TGC increases noise. The signal needs to be filtered using a bandpass filter with a resonant frequency close to the central frequency of the transducer. This filter could not be used from the beginning because the large difference in amplitude between the low frequency resonance and the superimposed echoes would have been problematic for the choice of components.

Figure 21: Steps of the signal processing
Envelope detection
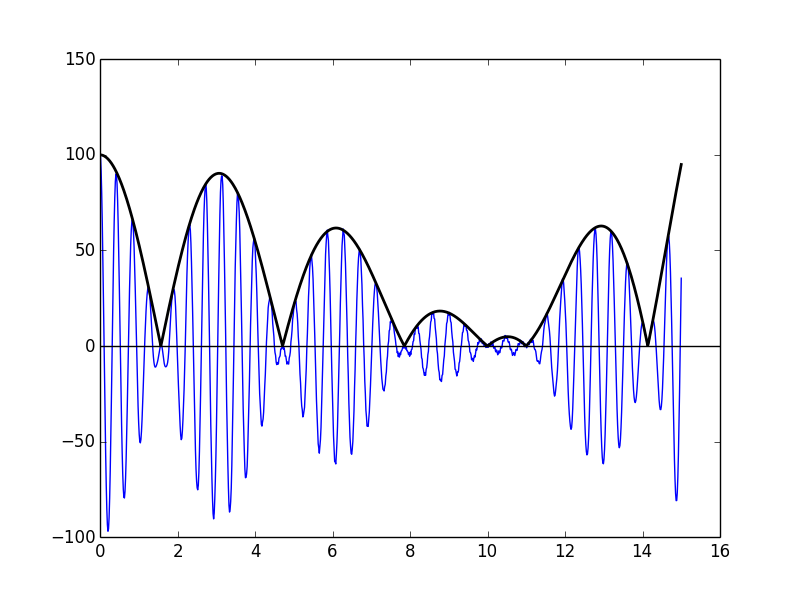
We are interested in the energy of the received echo signal which is contained in the envelope.
Figure 22: Envelope detection
Analog to digital conversion and calculation of pixels
The output of the envelope detector is sampled to be processed and sent as a digital signal to an application interfacing with the user. An ADC is used and the sampling frequency needs to be chosen wisely.
For each emitted pulse and each corresponding echo burst, a pixel line can be drawn corresponding to the line which has been insonated in the medium. The time of arrival of the echo burst corresponds to the distance travelled by the wave. Knowing the travel time between emission and reception and the propagation speed in tissues, the distance between interfaces can be determined. So we can map the medium insonated by the wave as a function of depth for each propagation line.
![]()
Figure 23: Grayscale conversion
It can be noted that the value at each sample point gives enough information rather than calculating the integral between two sample points.